matlab短期课程--基础
课程介绍
学习matlab对于工科生和理科生都是相当重要的,而且matlab的集成效果相当好。算法实现和直观图像结果是matlab的优点。 课程视频:B站MATLAB教程——台大郭彦甫
基本操作与矩阵输入
command line
Calculator
+ - * / ^
先乘除后加减,括号优先。关于更多的三角函数和其他特殊数学数字更重要的是查询help文档。
| e | \(\pi\) | 自然对数 |
|---|---|---|
| exp(1) | pi | log |
| exp()是e指函数 | 自然对数相当于\(\ln\) |
EX: \[ \sin(\sqrt{\pi})+\ln(\tan(1))\]
1 | sin(sqrt(pi))+log(tan(1)) |
计算结果储存在ans当中,可以再对ans进行操作。
Variables
- 变量不需要提前声明(declare)
=是赋值who或者whos可以查看变量的类型- Special Variables and Constants
| 关键字 | 关键字 | 关键字 | 关键字 |
|---|---|---|---|
| i,j | Inf | eps | NaN |
| complex number | 无穷大 | 非常小的数 | not a number |
iskeyword可以用来查询关键字
- Calling Priority 由高到低:Variable \(\rightarrow\) Built-in function \(\rightarrow\) Subfunction \(\rightarrow\) Private function (MEX-file P-file M-file)
1 | cos='This string .' |
并且clear ans可以清除指定的变量,注意clear会清除所有工作区的变量。
Format
1 | >> format long |
- format type有以下几种形式:
| short | long | shortE | longE | bank | hex | rat |
|---|---|---|---|---|---|---|
| 短型 | 长型 | 科学计数法 | 科学计数法 | ex:3.14 | 转为16进制 | 转为有理数 |
- Calculate:\[\frac{3}{14}+\frac{4}{14}+\frac{5}{15}=\]
1 | >> format long |
小技巧
a=10;与a=10的区别在于后者不会显示结果clcclear command window displayclearremove all variable in the workspacewho与whosshow information
Array(Vector and Matrix)
- vector
a=[1 2 3 4]这是一个行向量(row vector)
b=[1;2;3;4]这是一个列向量(column vector)
- matrix
A=[1 21 6;5 17 9;31 2 7]这是一个矩阵(matrix)
Array Indexing
\[A=\begin{bmatrix} 1 & 21 & 6 \\ 5 & 17 & 9 \\ 31 & 2 & 7 \\ \end{bmatrix}\]
1 | >> A(1,2) %第一行,第二列 |
1 | >> A([1 3],[1 3]) %第一个中括号里的是行数,第二个是列数 |
Replacing Entries
A(1,2)=76这将矩阵中的21转为了76
Colon Operator
Want to create a long array:A=[1 2 3...100]?
A=[1:100]
若等差为2,可以进行以下操作:A=[1:2:100],同时可以和matrix类似使用
delete by colon operator
1 | >> a=[1 2 3 ;2 3 5;1 2 3] |
Array Concatenation
F=[A B]或者F=[A;B],将矩阵连接。
1 | >> a=[1 2;3 4]; |
Array的操作
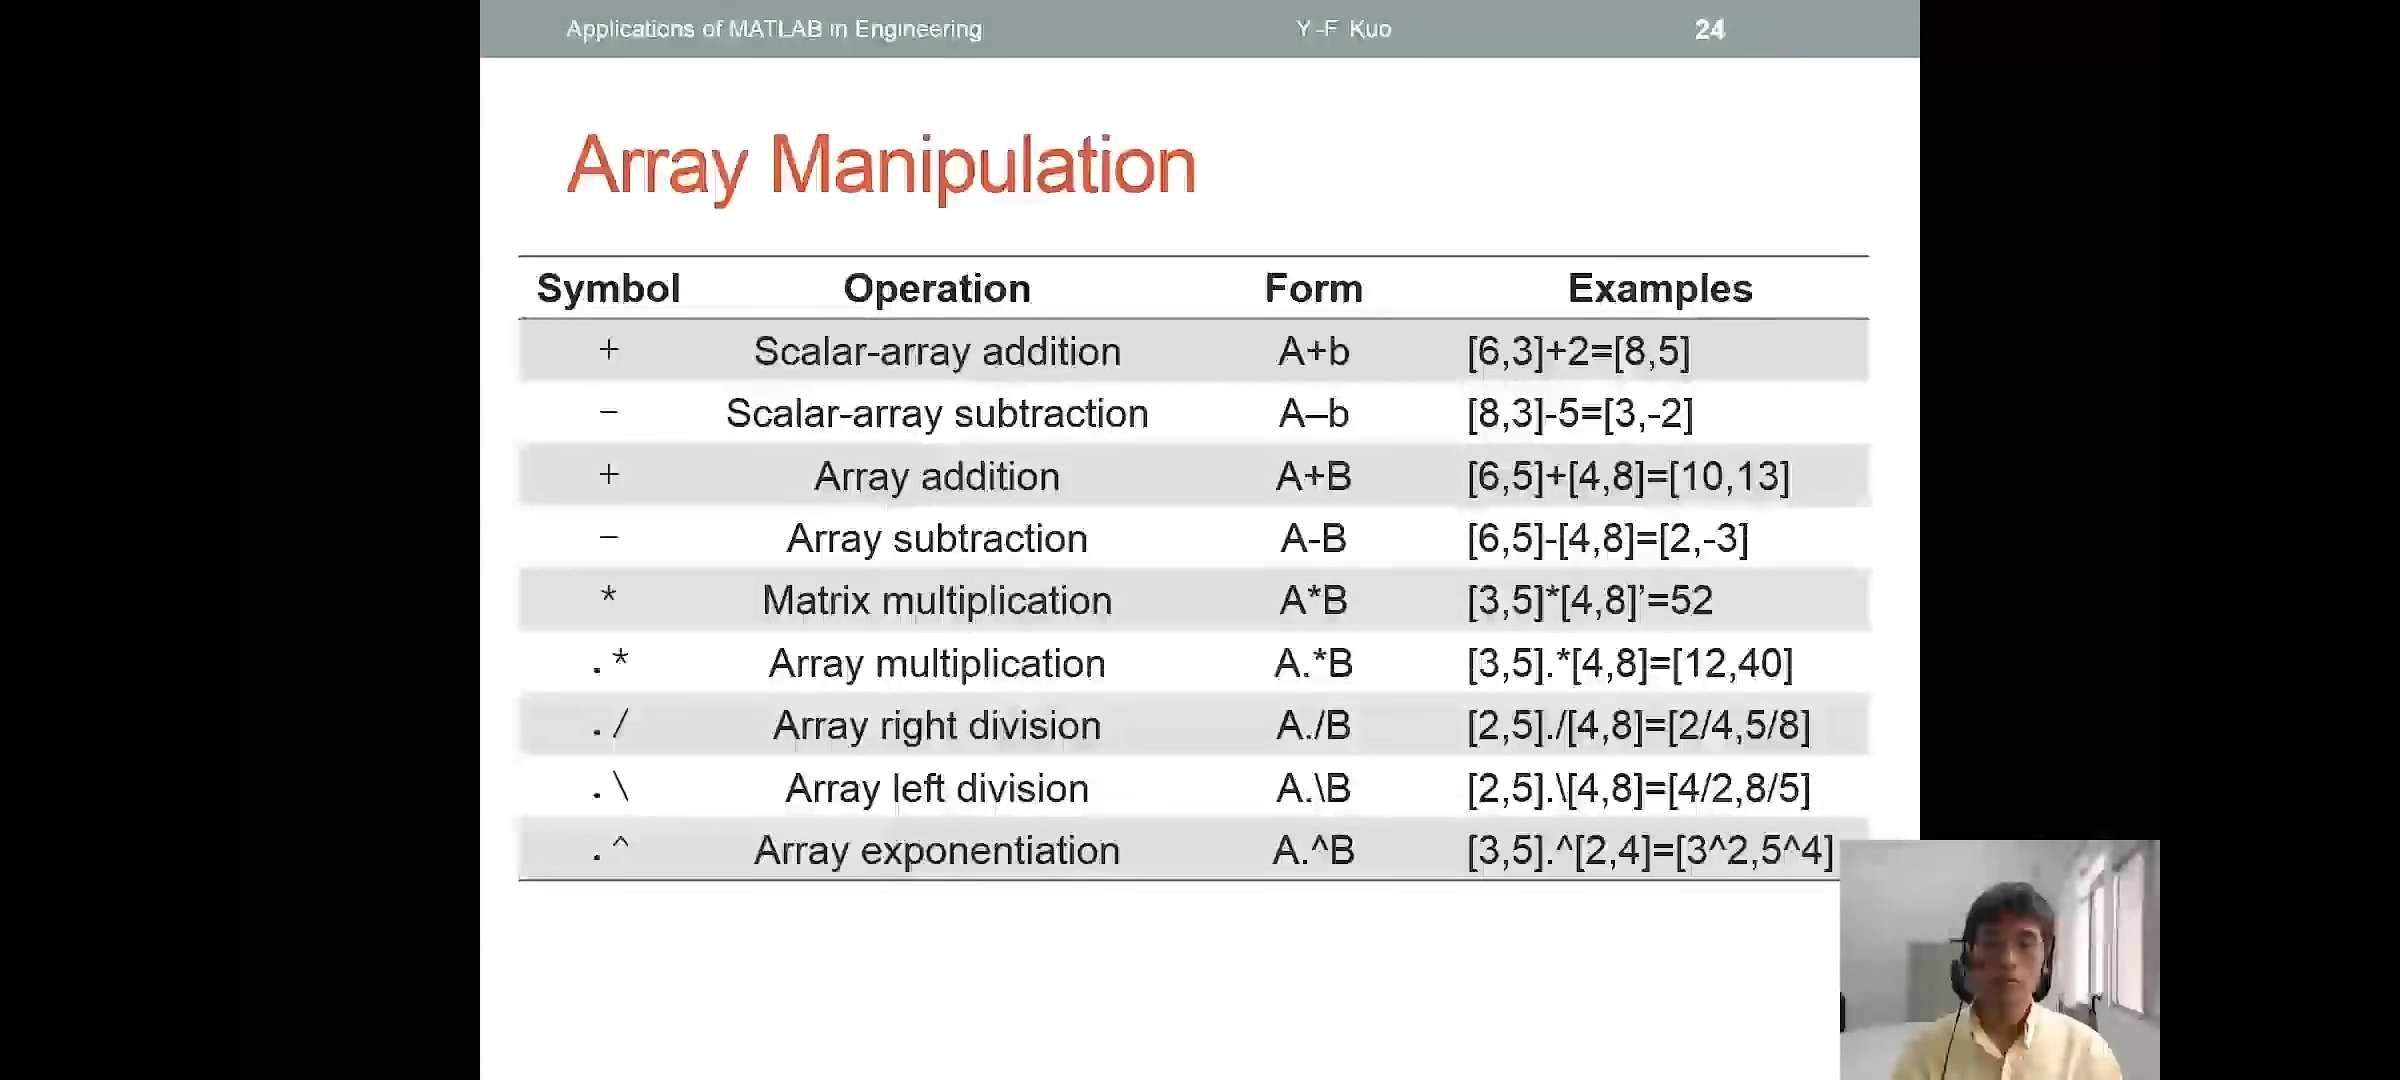
- Array Manipulation operators on array:
+ - * / . '
.*这是点乘, 1除以1 2除以2(element operation)
'这是转置,transpose
+,若是加一个实数,则是将每个entries加上这个实数
1 | >> a.*b |
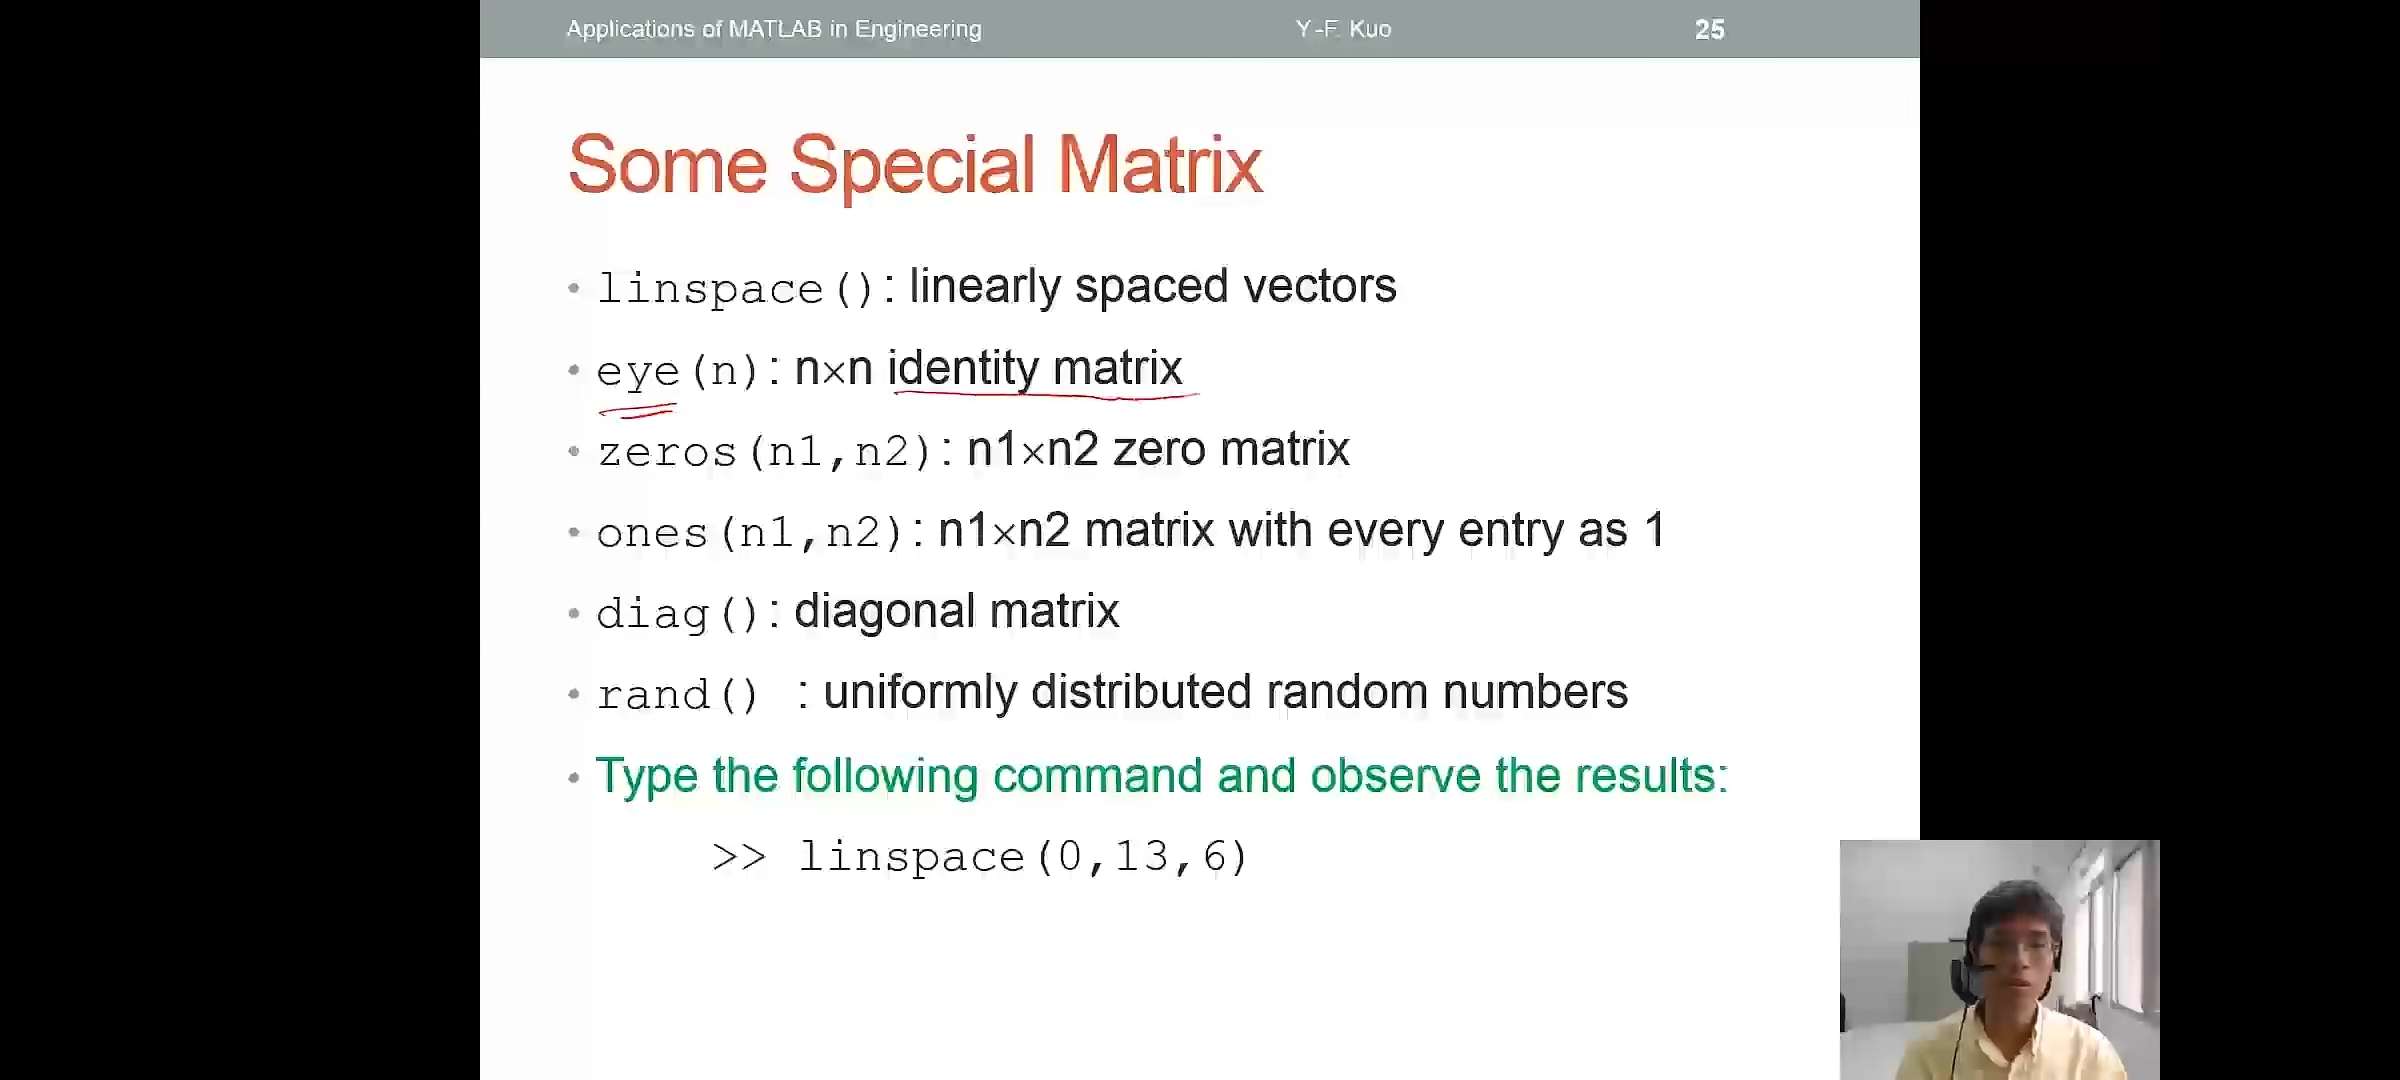
- Some Special Matrix
- Some Matrix Related Functions
max(A)矩阵中每个column中最大的数字;
max(ma(A))矩阵中的最大数字;
sum(A)矩阵中每个column的sum,mean(A)也是如此;
sort(A)排序每个column的排序;
sortrows(A)排序每个row;
size(A) length(A) find(A==m)分别是矩阵的大小(行数和列数)、向量(维度)的长度和寻找等于某数字(m)的位置。
结构化程式与自定义函数
Script Writing
- script is saved as
<file>.m.
%一个百分比是comment(注释);%%两个百分比则是section(可以分开程序,分别运行)。
- 设置断点就进入了debug模式,命令行中是
K>>#### script flow - A script runs line by line
- Structured programming techniques are app;ied to make the program looks neat.
flow control
- if else :condition is true?
- for
- switch case
- try catch
- while
- break
- continue
- end
- pause
- return
logical operators
< |
<= |
> |
>= |
== |
~= |
&& |
|| |
|---|---|---|---|---|---|---|---|
| 略 | 略 | 略 | 略 | equal to | not equal to | and | or |
介绍
if elseif else
1
2
3
4
5
6
7if condition 1
statement1
elseif condition 2
statement 2
else
statement3
end %elseif and else are optional
EX: 1
2
3
4
5
6a=3;
if rem(a,2)==0 % remainder 余数
disp('a is even')
else
disp('a is odd')
end
switch
1
2
3
4
5
6
7
8
9
10
11
12switch expression
case value1
statement1
case value2
statement2
otherwise
statement
end
while
1 | while expression |
Exercise: \[\sum_{i=1}^{999}i\]
1 | i=1; |
for 1
2
3
4
5
6
7
8
9
10
11
12
13
14
15
16
17for variable =start:increment:end
commands
end
%ex
for n=1:2:10
a(n)=2^n;
end
disp(a)%还是会补零进去
%解决
clear a
for n=1:2:9
a((n+1)/2)=2^n;
end
disp(a)%或者给a(n)为a(i),即一个新的变量作为index
- Pre-allocating Space to Space(预分配)
没有预先分配空间,matlab运行程序会变的比较慢。所以提前给储存数据的数据类型一个确定的大小。
tic和toc是用于计时的代码。
1 | %% |
Exercise: Use structured programming to:
- Copy entries in matrix A to matrix B - Change the values in matrix B
if their corresponding entries in matrix A is negative \[ A=\begin{bmatrix}
0 &-1 & 4\\
9 &-14& 25 \\
-34& 49 &64 \\
\end{bmatrix}\]
1 | clear |
break
- terminates the execution of for or while loops
- Used in iteration where convergence is not guaranteed
tips for script writing
- At the beginning of your script,use command
clear allto remove previous variables andclose allto close all figures - Use semicolon
;at the end of commands to inhibit unwanted output - Use ellipsis
...(换行号)to make scripts more readable - Press ctrl+c to terminate the script before conclusion
Functions
- Functions are written when we need to perform routines
- yes input arguments
- yes output arguments
- operate on date in the local workspace
edit(which('mean.m'))打开mean函数
User Define Functions
1 | function x = freebody(x0,v0,t) |
User with Multiple Inputs and Outputs
function[a,F]=acc(v2,v1,t2,t1,m)
当然在做乘除运算时最好要用点乘或点除法
Exercise:
- Write a function that asks for a temperature in degrees Fahrenheit
- Compute the equivalent temperature in degrees Celsius
- Show the converted temperature in degrees Celsius
- The function should keep running until no number is provided to convert
- You may want to use these functions:
- input;isempty;break;disp;num2str
Function Default Variables
inputname:variable name of function inputmfilename:file name of currently running functionnargin:Number of function input argumentsnargout:Number of function output argumentsvarargin`:Variable length input argument listvarargout:Variable length output argument list
Function Handles(pointer)
A way to create anonymous functions,i.e.,one line expression functions that do not have to be defined in .mfile.
f=@(x) exp(-2*x);,f指向这个function。
变量与档案存取
Data(Variables) Types
- Multidlmensional Array
- logical、char、numeric、cell、struct
- Scalar
- function handle(@)
Variable Type Conversion
double()当作function使用,其他同理。int8()八位整型。
char&string
- char(character)
- A character is represented in ASCII.
whos可以查看内容uint16()可以查看对应的ASCII码
- string
s1='hello';,an array collects characters- string
concatenation(连接):
s3=[s1 s2]和s3=[s1;s2]两种
logical operations and assignments
1 | >> str='addffdafa' |
Exercise:
Write a script that inverts any given string
s1='I like the letter E'变为s2='E rettel eht ekil I'
structure
- A method of storing heterogeneous data
- It contain arrays called fields
1 | >> student(2).name='frank'; |
structure functions
cell2struct:convertfieldnames:field names of structure,or public fields of objectsgetfield:field of structure arrayisfieldisstruct:determine whether input isorderfields:order fieldsrmfield:remove fields from structuresetfield:assign values to structurestruct:create struct arraystructfun:apply function to each field of structure
structure 是可以嵌套的,不断指到下一个。(nesting structure)
1
2
3
4
5
6
7
8>> A=struct('data',[12 12;11 14],'nest',struct('id',15452,'name','mike'))
A =
包含以下字段的 struct:
data: [2×2 double]
nest: [1×1 struct]
cell array
- store heterogeneous data
- similar to matrix but each entry contains different type of date
- declared using
{}
1 | >> A(1,1)={[1 2 3;4 5 6]}; |
matlab中是将A(1,1)作为pointer,这样就可以使得每个entries不同。
accessing cell array
{}are used to access the "content" of cell arrays- differences:
1 | >> A(1,1) |
cell array functions
cellcreate cell arraycell2matconvert array to numeric arraycell2structconvertcelldispcell array contentscellfunapply function to each cell in cell arraycellplotgraphically display structure of cell arraycellstrcreate cell array of strings from character arrayiscelldetermine whether input is cell arraymat2cellconvertnum2cellconvertstruct2cellconvert
ex: 1
2
3
4
5
6
7
8
9
10
11
12
13
14
15
16
17
18
19
20
21
22
23
24
25
26
27
28
29
30>> a=magic(3)
a =
8 1 6
3 5 7
4 9 2
>> b=num2cell(a)
b =
3×3 cell 数组
{[8]} {[1]} {[6]}
{[3]} {[5]} {[7]}
{[4]} {[9]} {[2]}
>> c=mat2cell(a,[1,1,1],3)
c =
3×1 cell 数组
{[8 1 6]}
{[3 5 7]}
{[4 9 2]}
% 中括号是row,最后的数字是column
multidimensional array(row column layer)
- 直接创建
cat()array concatenation 连接arrayreshapereturns a new array with assigned rows and columns
1 | >> A=[1 2;1 4]; |
checking variables and variable status
isfunction
例如,isinteger查看是否为整数。
File Access
| File Content | Extension | Description | Import Function | Export Function |
|---|---|---|---|---|
| Matlab formatted data | MAT | Saved Matlab workspace | load |
save |
| Text | Space delimited numbers | load |
save |
|
| spreadsheet | XLS,XLSX | excel | xlsread |
xlswrite |
save()andload()
save mydata.mat -ascii
储存形式为ASCII码,也可以不用添加;
load 'mydata.mat','-ascii'
excel file
reading and writing :xlsread() xlswrite()
score = xlsread('04Score.xlsx','B2:D4')读取对应sheet里面的数据(string中的东西可能不在)
xlswrite('04Score.xlsx',M,1,'E2:E4');写入到对应的位置,M为写入的变量,1是sheet
xlswrite('04Score.xlsx',{'Mean'},1,'E1');加入Mean标条
getting text in excel spreadsheet
[score header]=xlsread('04score.xlsx');读取了text部分,当然也可以同时写入到Excel里面
low-level file input/output
- Read and write file at the byte or character level
- A file has ID fid(本质上是pointer)
- Location in the file is specified by a pointer that can be moved around
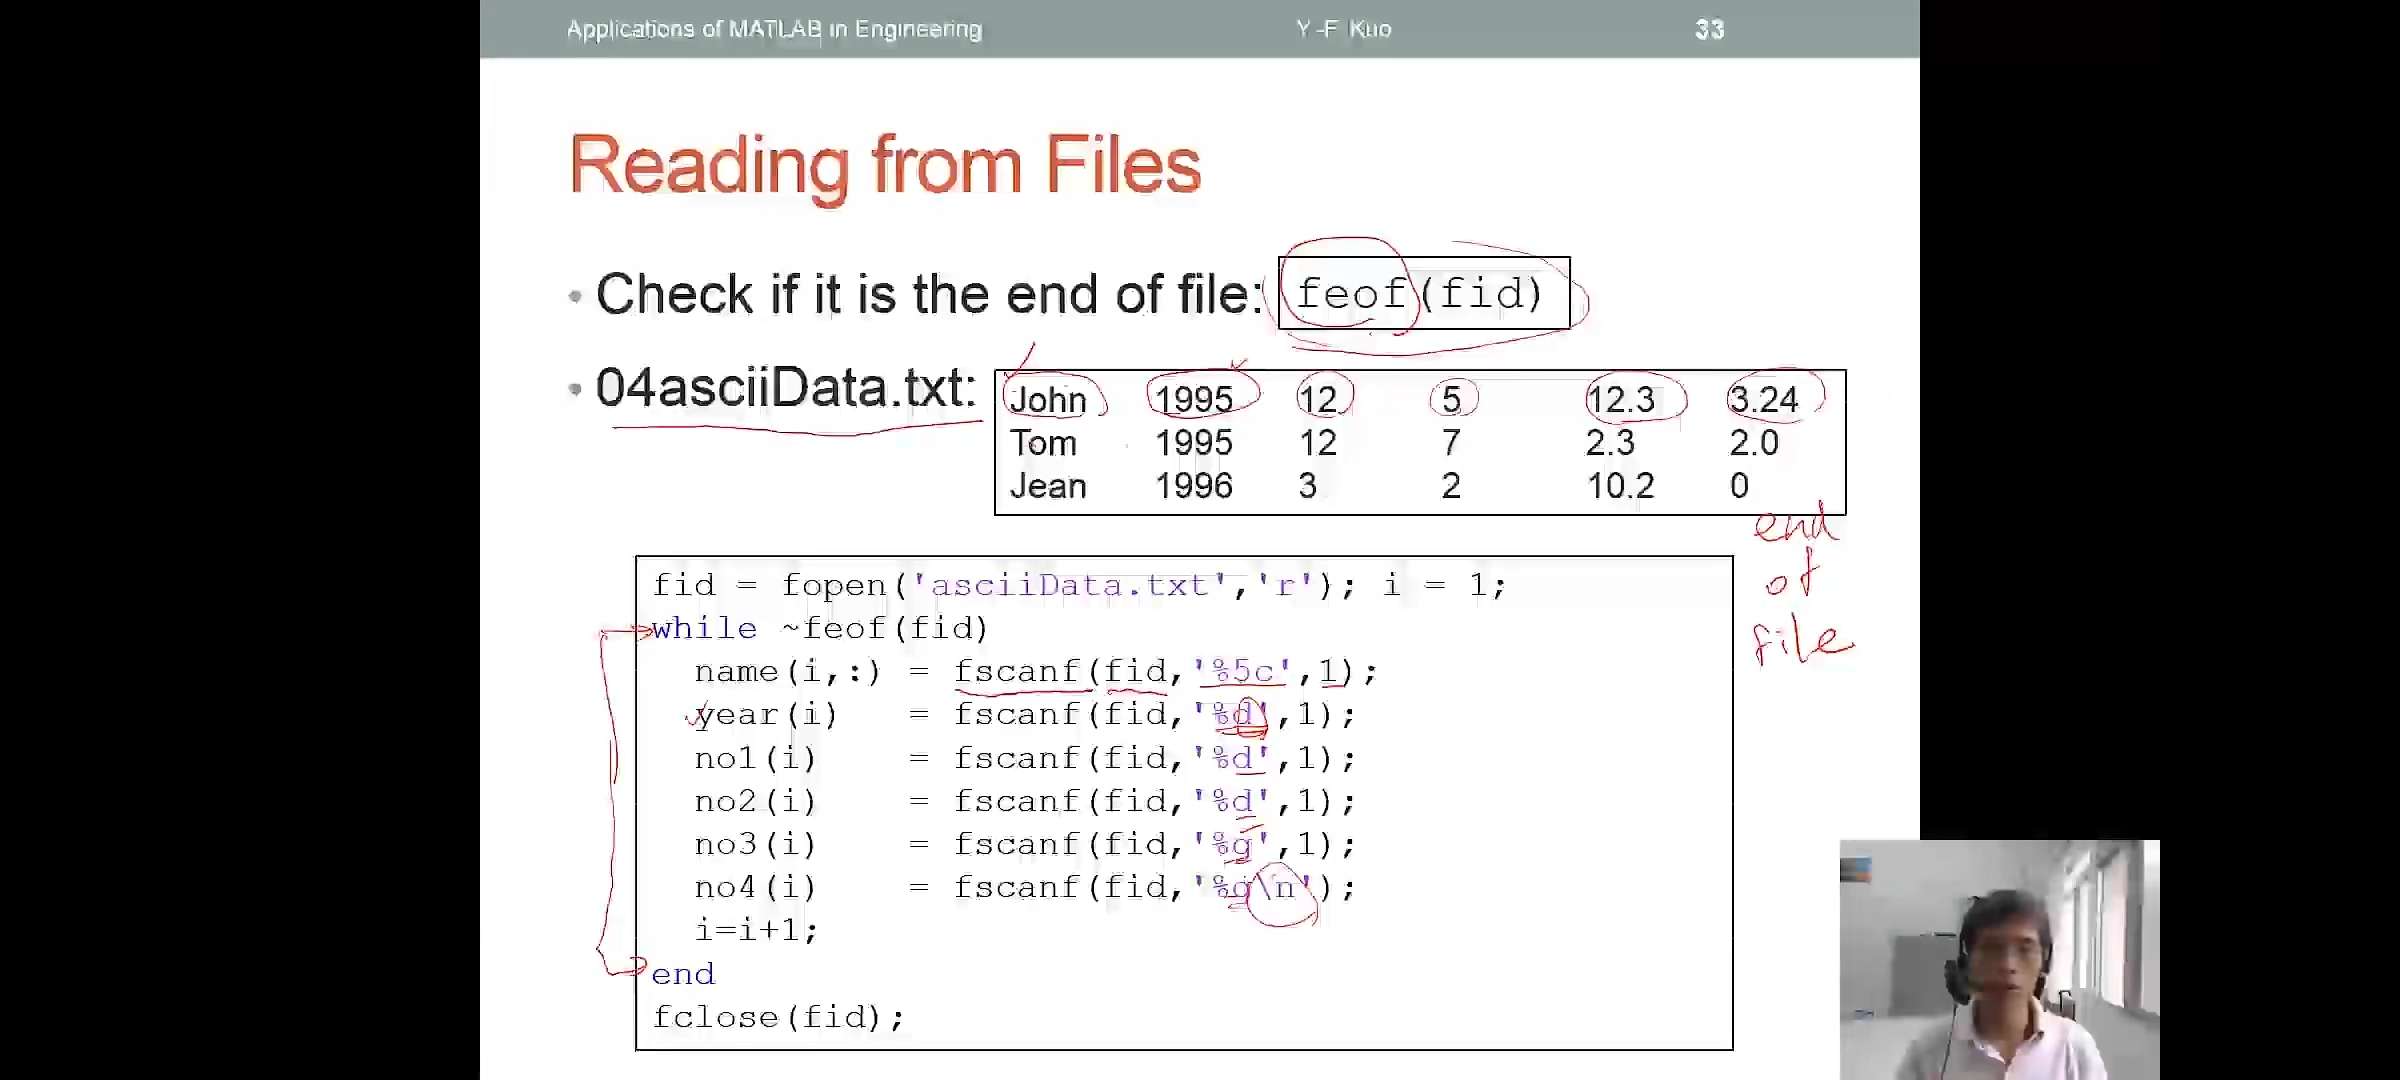
low-level I/O functions
fopenopen file or obtain information about open filefcloseclosefscanfread data from text filefprintfwrite data to text filefeoftest for en-of-fileopen and close file
fid =fopen('[filename]','[permission]');permission(采取的操作)读取r或者写入w
status=fclose(fid)
顺序是:先generate出数据,再打开file,然后将数据write into the file,最后close the file
1 | x= 0:pi/10:pi; |
read and write through formatted I/O
- Read
A=fscanf(fid,format,size); - Write
fprintf(fid,format,x,y,...); - format 是format specifier
%d %f %n - size 是amount of data to read
- x,y,...是 data to write
ex:
初阶绘图
basic plotting
plot from "Data"
- Matlab does not understand functions \[f(t)=\sin(2\pi t)\]
- Strategies:
- generate the numeric values of function over specific range
- display the data "points" in a graphical way
plot()
plot(x,y)plots each vector pairs(x,y)plot(y)plots each vector pairs(x,y),where x=[1...n],n=length(y)
hold on/off
- use
hold onto have both plots in one figure hold on打头,hold off结尾,在script里面使用
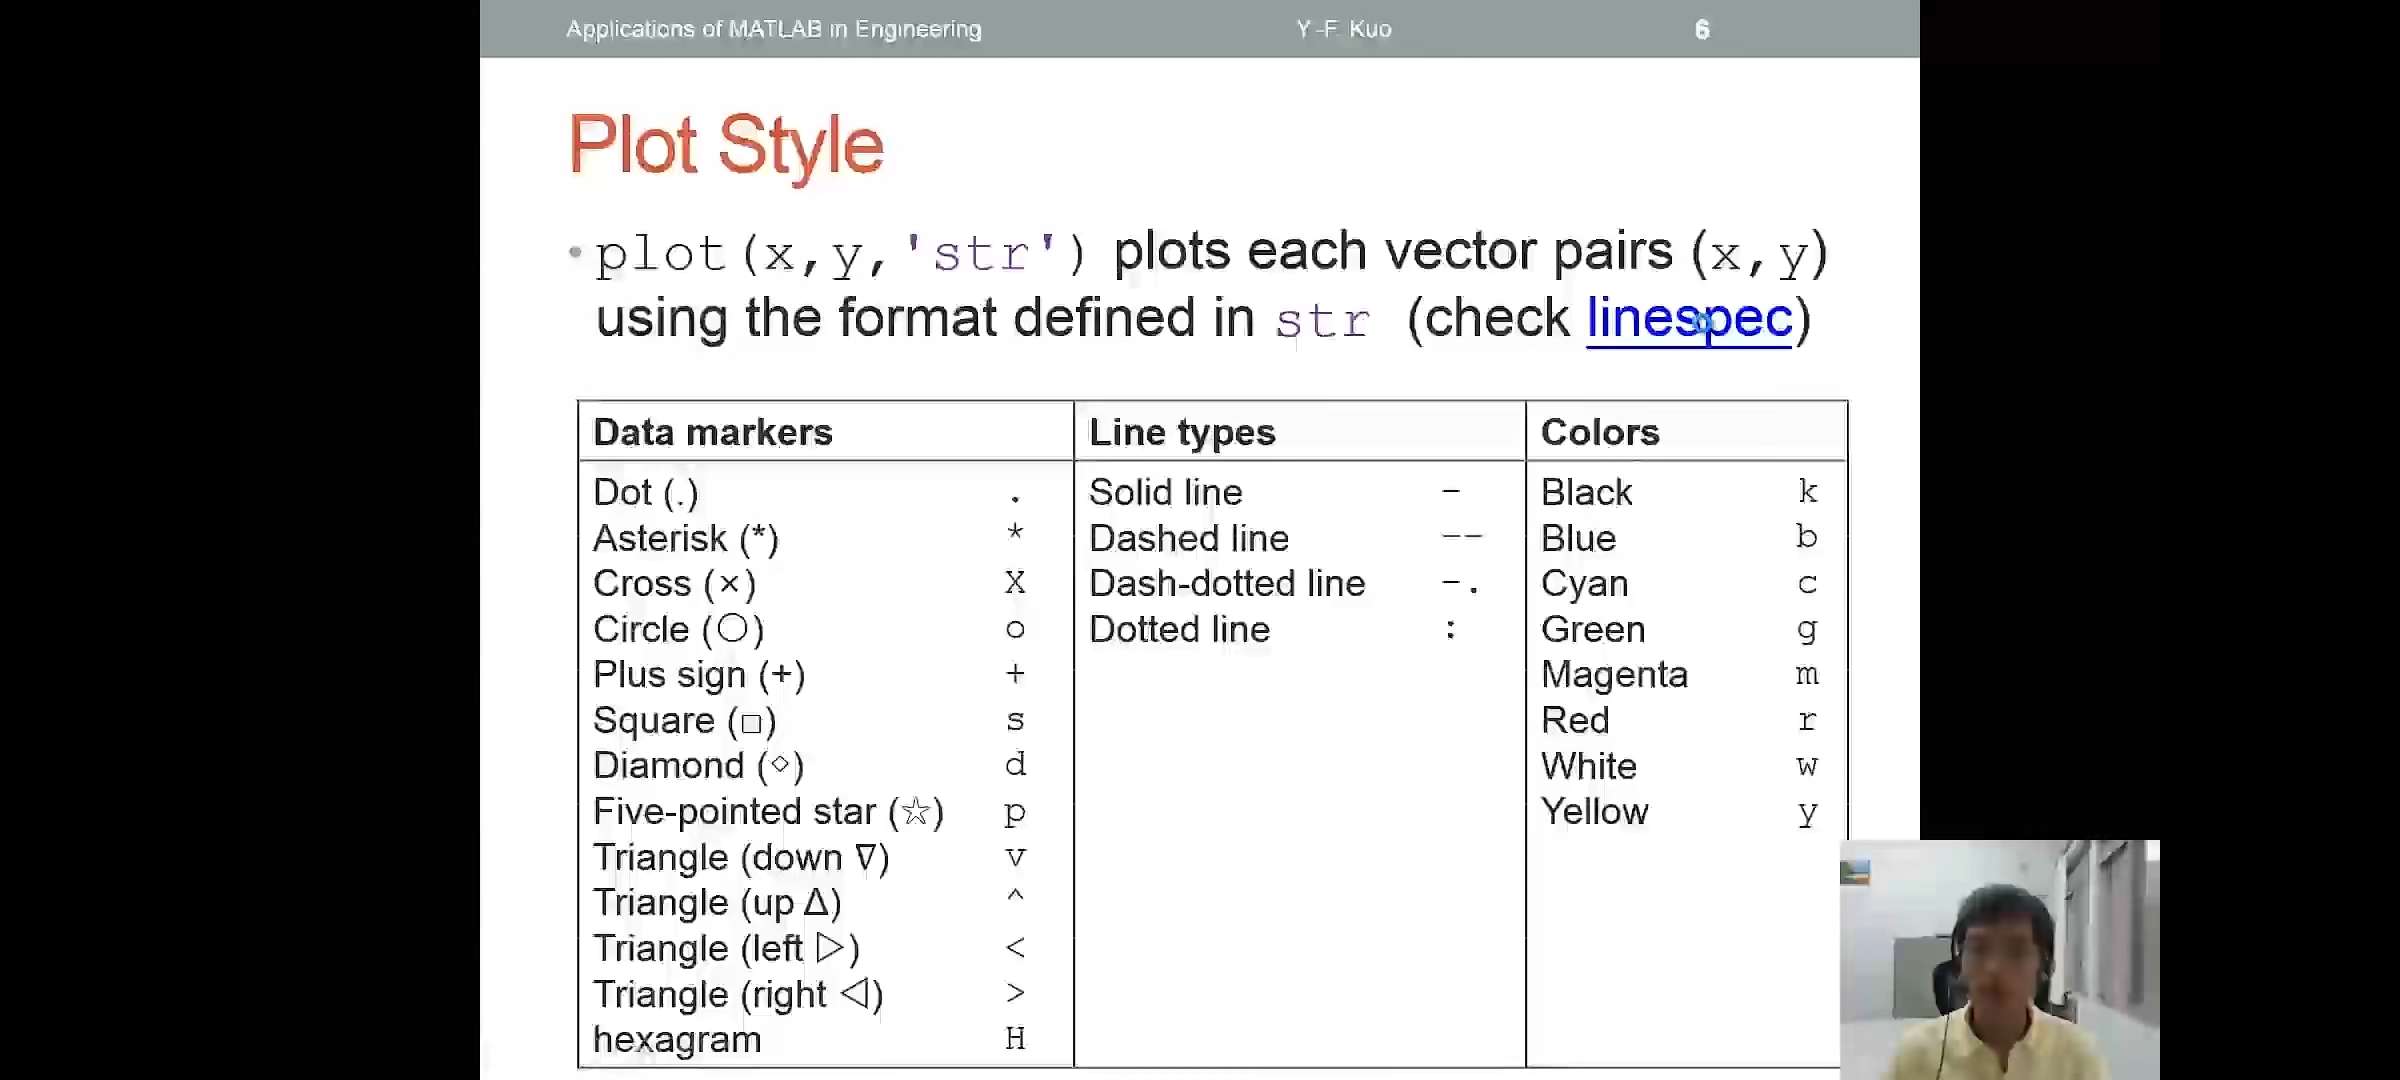
plot style
plot(x,y,'str')plots each vector pairs(x,y) using the format defined instr(更多操作进入help中的 linespec查看)
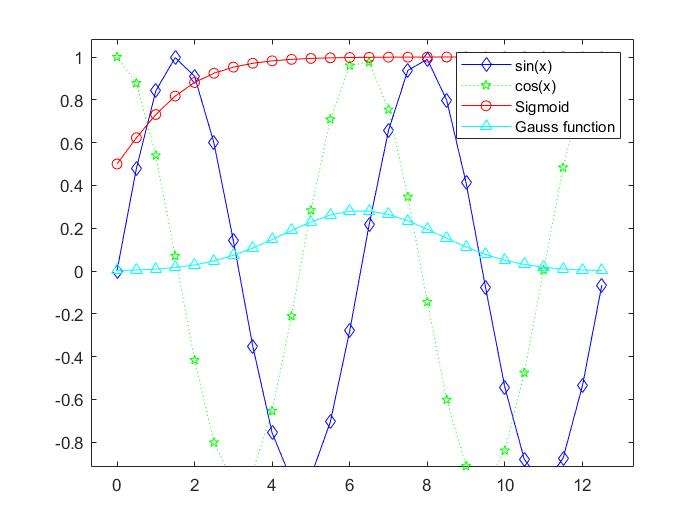
legend()
- add legend to graph `legend('L1',...)
- position adjustment
1 | x=0:0.5:4*pi; |
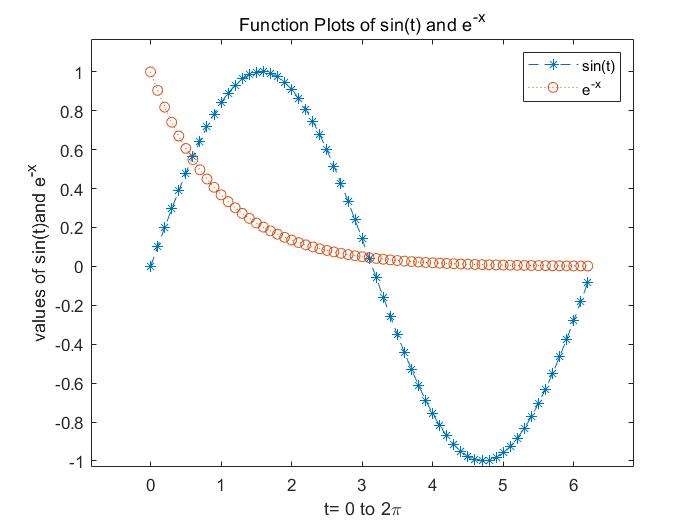
title()and?label()
title()xlabel()ylabel()xlabel()
1 | x=0:0.1:2*pi; |
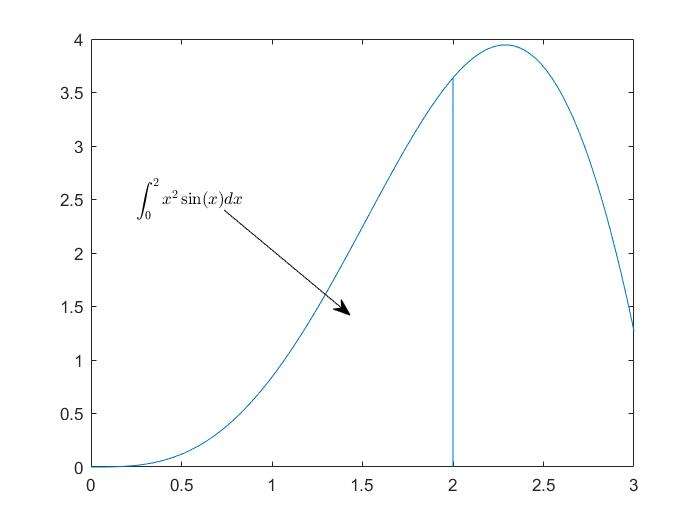
text()andannotation()
- text with mathematical expression using Latex
1 | x=linspace(0,3);y=x.^2.*sin(x); |
Exercise:
- plot \(f\) as a black line and
\(g\) as a series of red circles for
the range \(t=1\) to \(2\) in one figure \[f=t^2 \quad g=\sin(2\pi t)\]
- label each axis, and add title and legend
graphical object properties
figure adjustment
- several properties:
- font
- font size
- ine width
- axis limit
- tick position
- tick label
- 调整figure的一些性质
graphical objects
- a figure is composed of many objects
1
2
3
4
5x=linspace(0,2*pi,1000);
y=sin(x);
plot(x,y);
set(gcf,'Color',[1,1,1]);
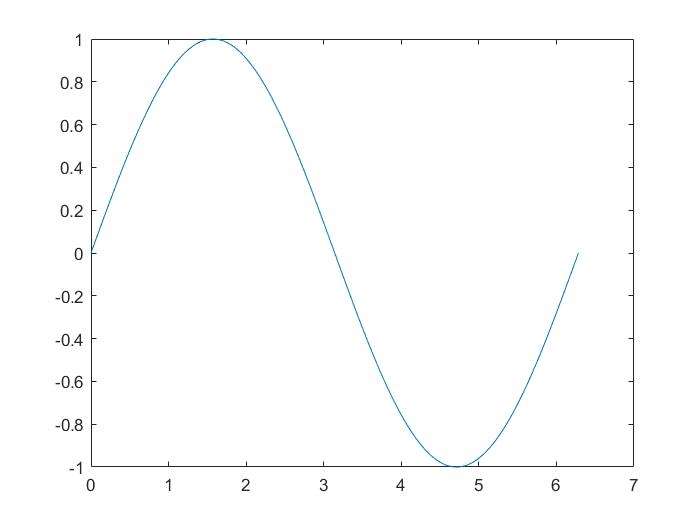
figure properties
得到figure后,可以进入编辑中的图窗属性。可以对像axes、line等一些objects进行细致地修改。(figure line axes)
modifying properties of an object
- Strategy:
- Identify the "handle" of an object
- fetch(拉取) or modify(修改) the object's properties
- For example, to change the limits of the x-axis:
- Find the handle of the x-axis
- Modify the limits
identifying the handle of an object
- upon creation
h=plot(x,y)储存辨识码 - utility functions(找出辨识码):
gcareturn the handle of the "current" axesgcfreturn the handle of the "current" figureallchidfind all children of specified objectsancestorfind ancestor of graphics objectdeletedelete an objectfindallfind all graphics objects
fetching or modifying properties
- to fetch properties,use
get() - to modify properties,use
set()
getting object properties
get()可以得到非常多的图形性质,找到相关的图形确切的性质
modifying properties
- setting axes limits
set(gca,'XLim',[0,2*pi]);set(gca,'YLim',[-1.2,1.2]);- Alternatives:
xlim([0,2*pi]);
- setting font and tick of axes
set(gca,'FontSize',25);改变axes的字体大小为25set(gca,'XTickLabel',0:90:360);改变x轴的单位区间和limset(gca,'FontName','symbol')将x轴的字体名称设为符号,这样xticklabel可以改为\(\pi\)相关的属性
line specification
- line style and
width:
set('LineStyle','-.','LineWidth',7.0,'Color','g'); - alternative:
plot(x,y,'-.g',...,'LineWidth',7.0)
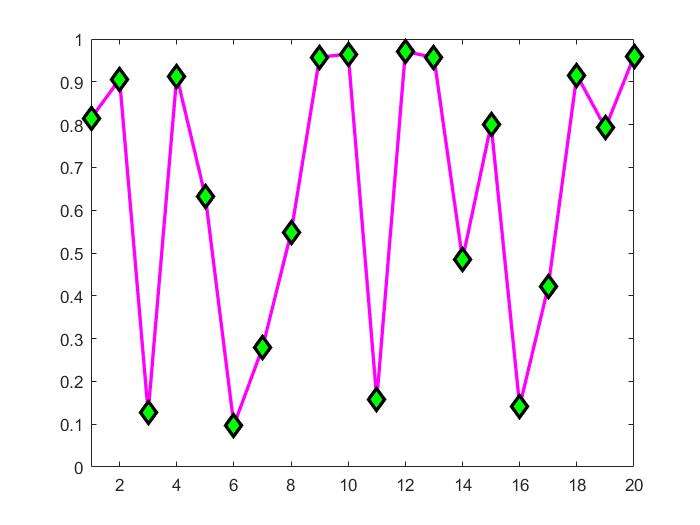
marker specification
- face and edge colors of the marker
1
2
3
4
5x=rand(20,1);
set(gca,'FontSize',18);
plot(x,'-md','LineWidth',2,'MarkerEdgeColor','k',...
'MarkerFaceColor','g','MarkerSize',10);
xlim([1,20]);
multiple figures
create a figure window by calling
figurefigure,plot(x,y1):be careful when using the
gcfhandle where there exists multiple figuresfigure position and size
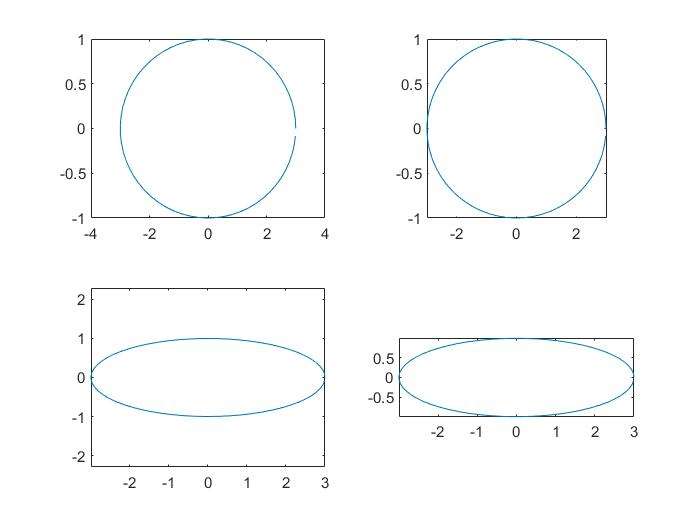
figure('Position',[left,bottom,width,height]);several small plots in a figure (subplot)
subplot(m,n,1);m是行,n是列,1是该幅图的位置1
2
3
4
5
6
7t=0:0.1:2*pi;
x=3*cos(t);
y=sin(t);
subplot(2,2,1);plot(x,y);axis normal
subplot(2,2,2);plot(x,y);axis square
subplot(2,2,3);plot(x,y);axis equal %x和y的大小相同
subplot(2,2,4);plot(x,y);axis equal tight
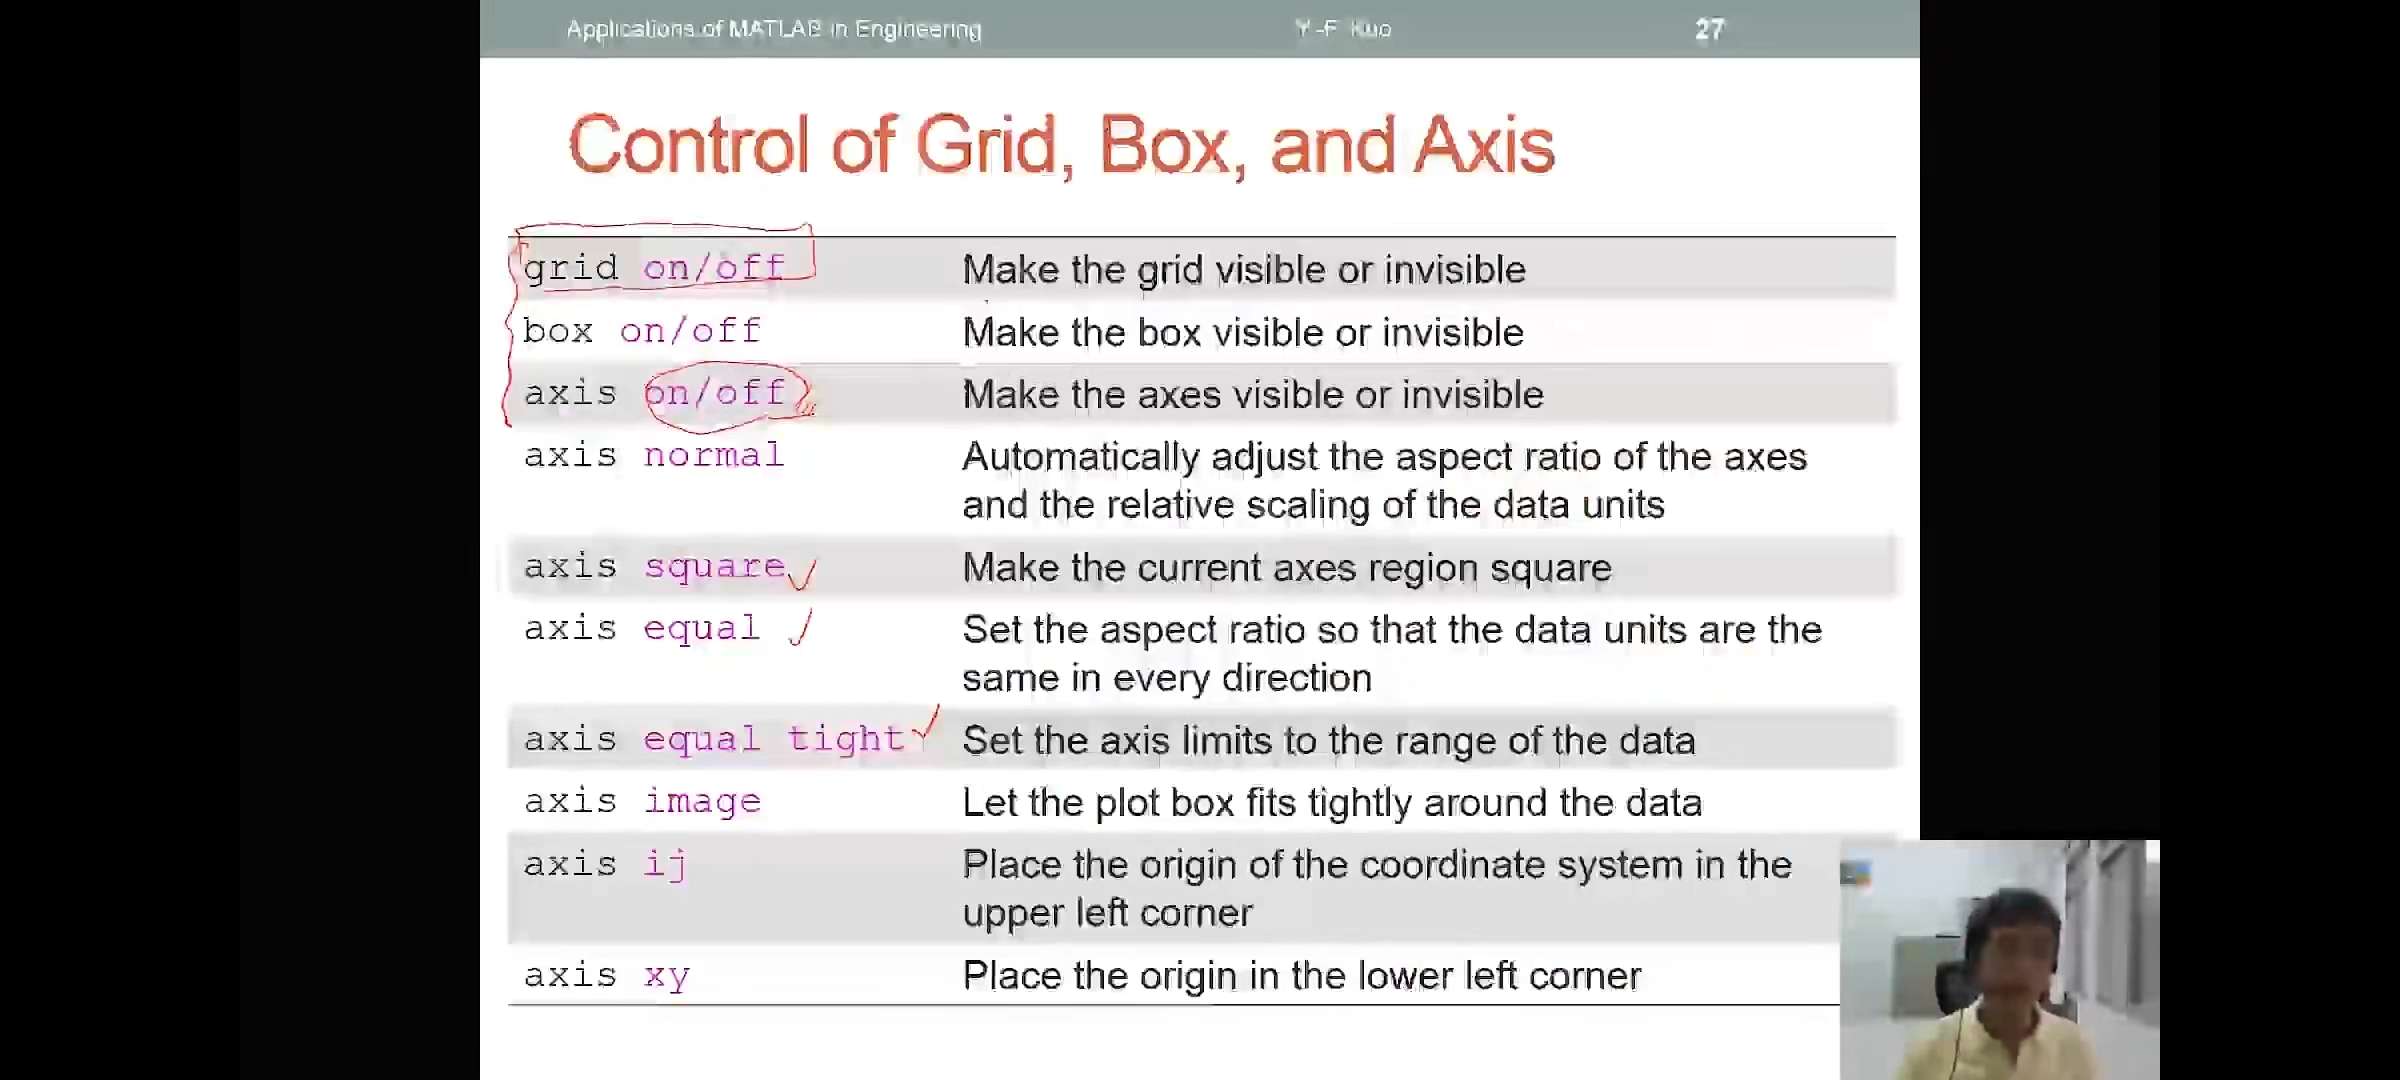
control of grid and box and axis
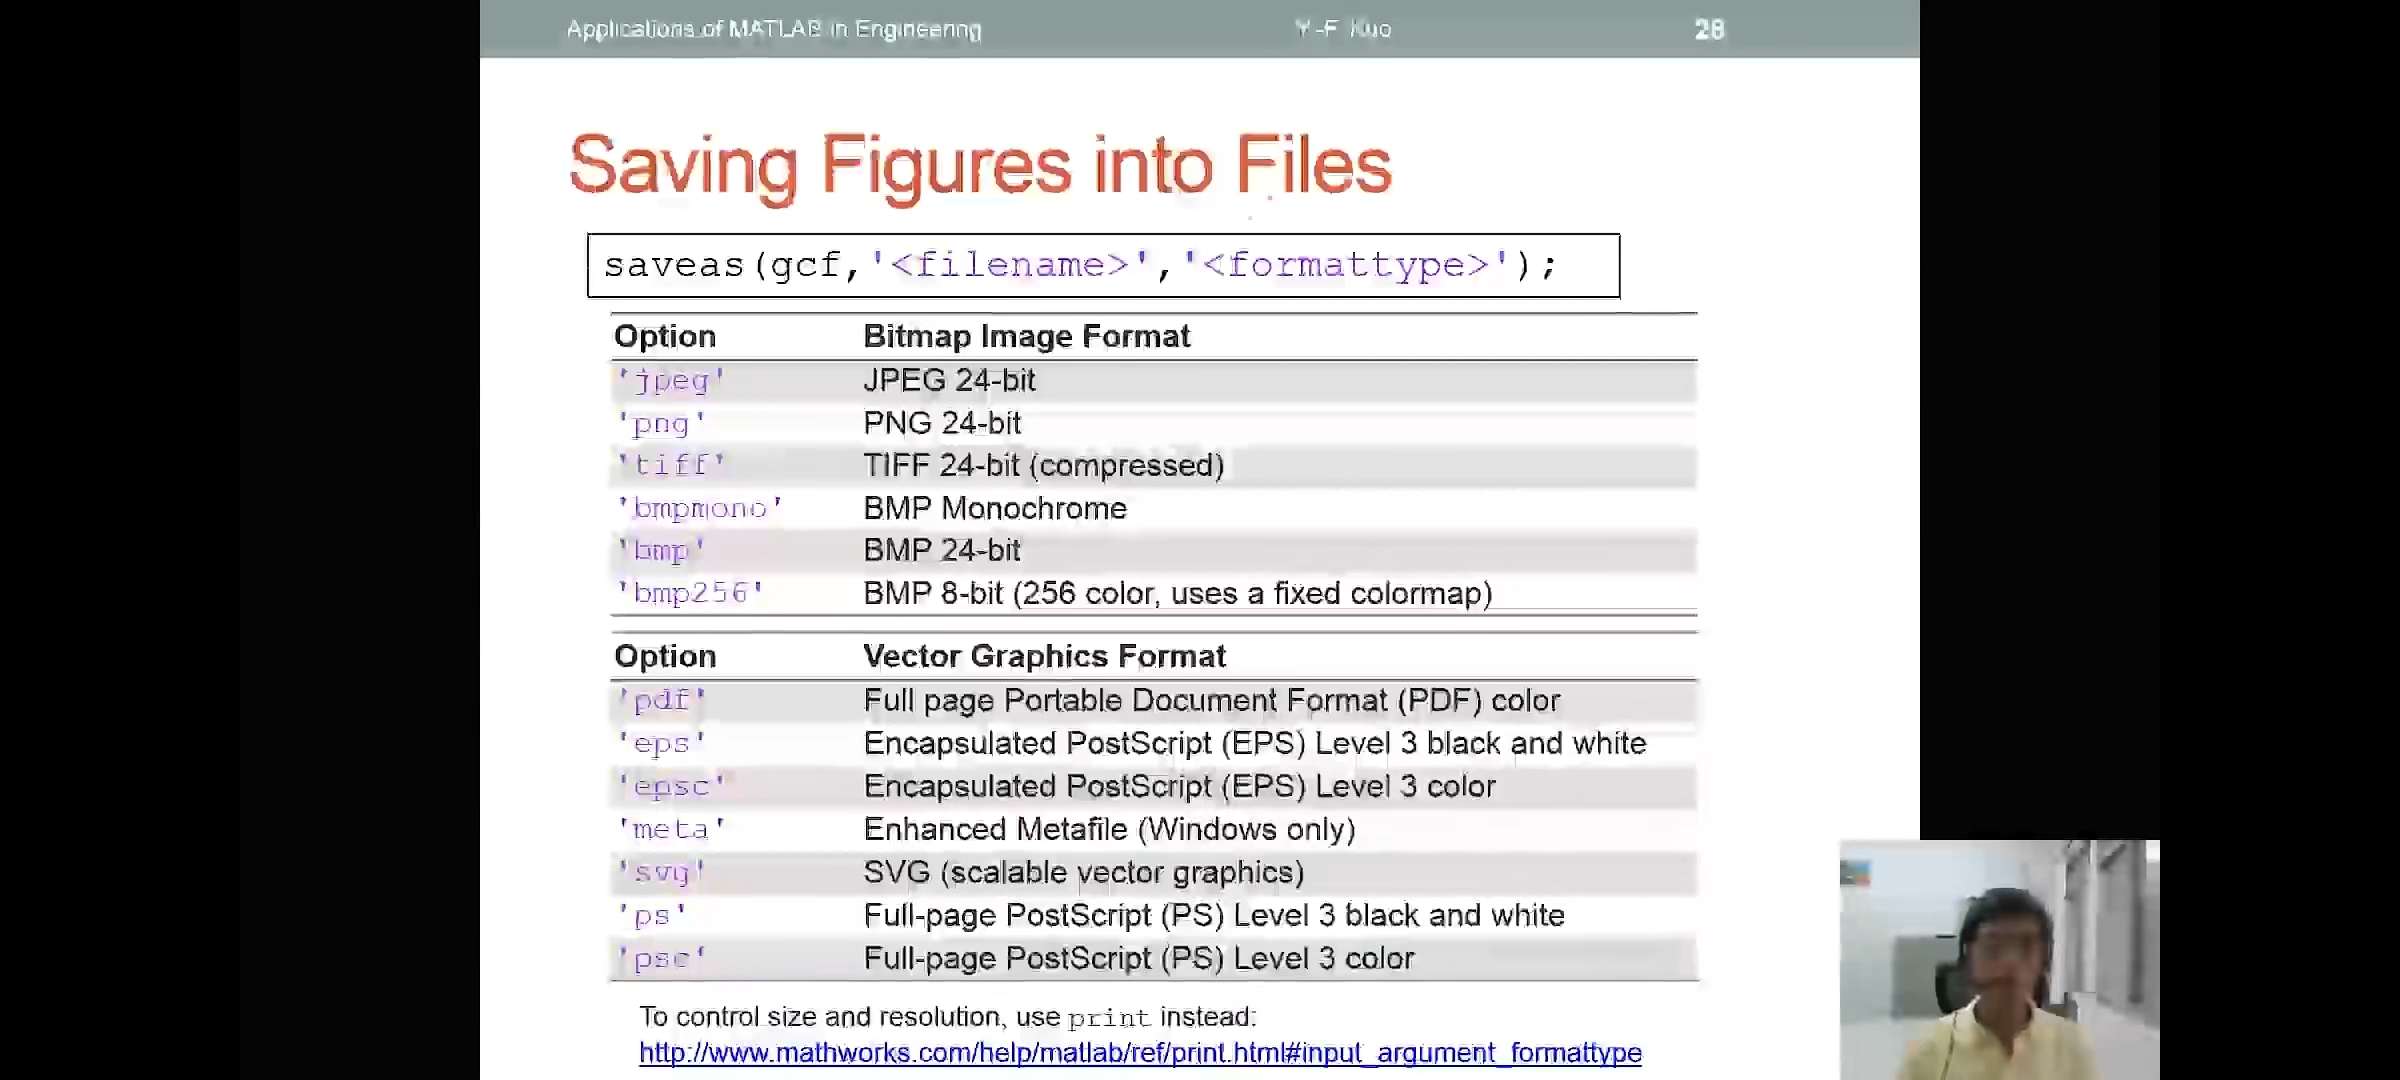
saving figures into files
saveas(gcf,'<filename>','formattype');,高解析度还是使用print为妙
进阶绘图
advanced 2D plots
special plots
- function
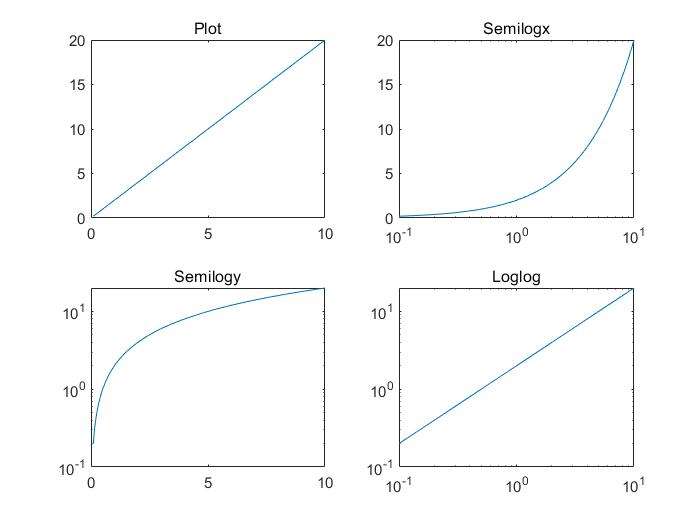
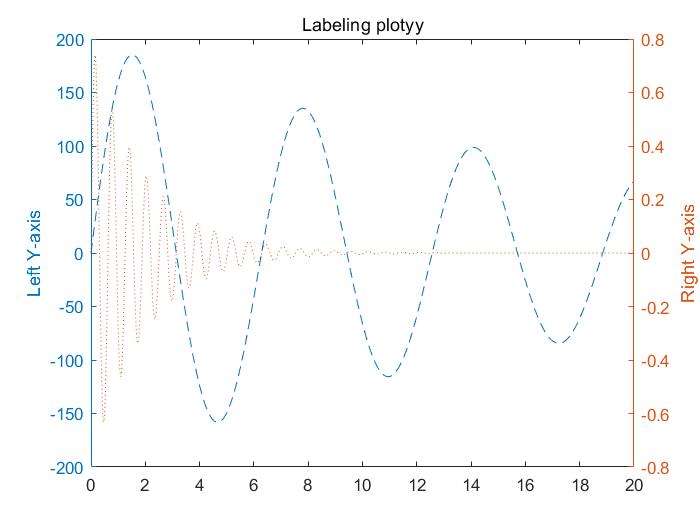
logloggraph with logarithmic(对数的) scales for both axessemilogxgraph with a logarithmic scale for the x-axis and a linear scale for the y-axissemilogygraph with a logarithmic scale for the y-axis and a linear scale for the x-axisplotyygraph with y-tick labels on the left and right side
- function
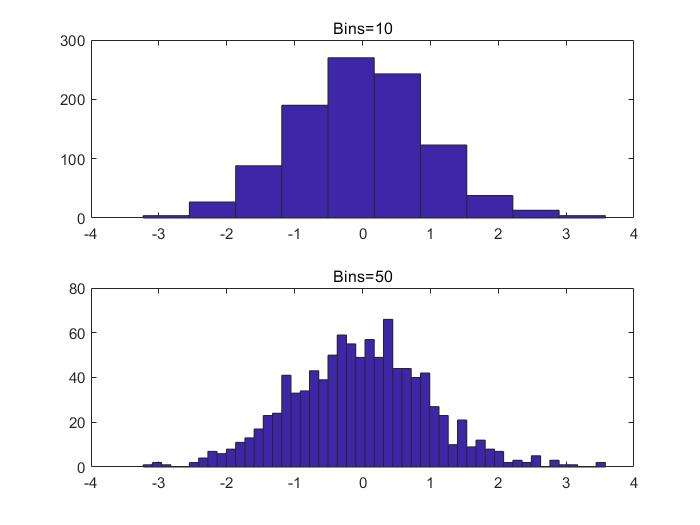
histhistogram plot(直方图)barbar graphpiepie chartpolarpolar coordinate plot
logarithm plots
x=logspace(-1,1,100)产生一个对数变量,从\(10^{-1}\)到\(10\)
set(gca,'XGid','on') 对下面的程序可以设置网格
1 | x=logspace(-1,1,100); |
plotyy()意思是有两个y轴
1 | x=0:0.01:20; |
histogram
1 | y=randn(1,1000); |
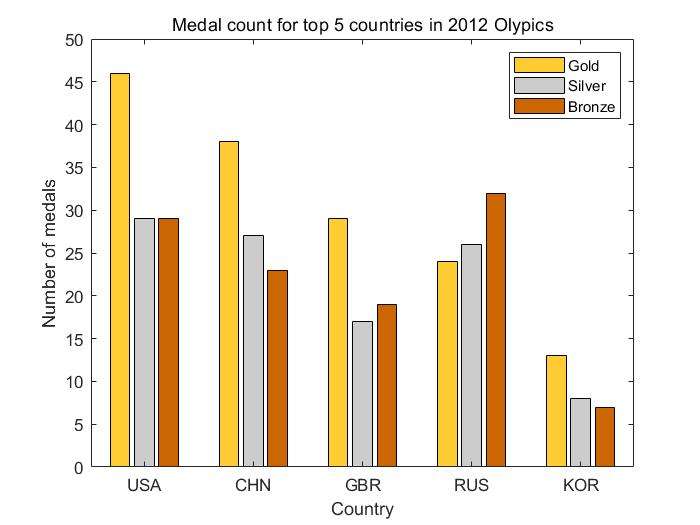
bar charts
1 | x=[1 2 5 4 8]; |
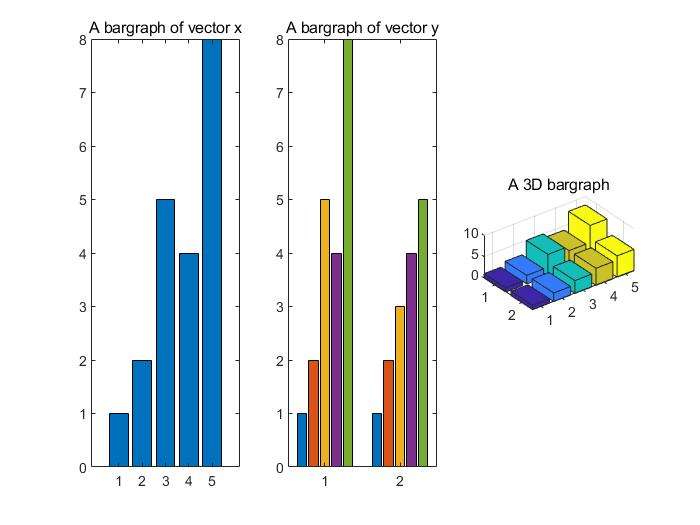
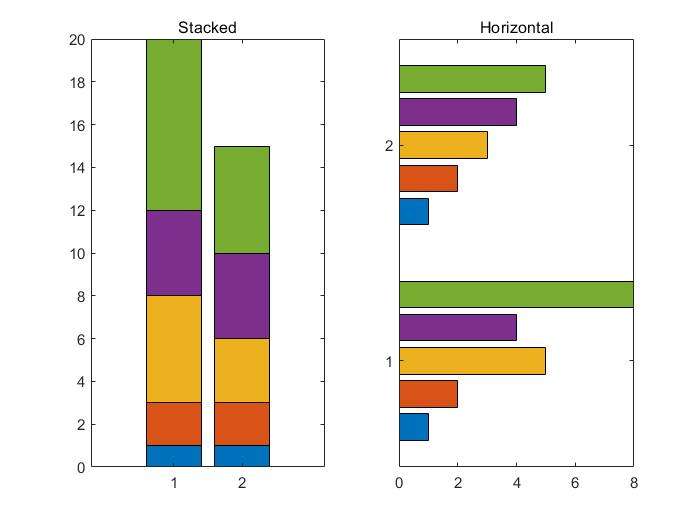
还有其他种类的bar chart(stacked栈 and hortizontal bar charts)
1 | x=[1 2 5 4 8]; |
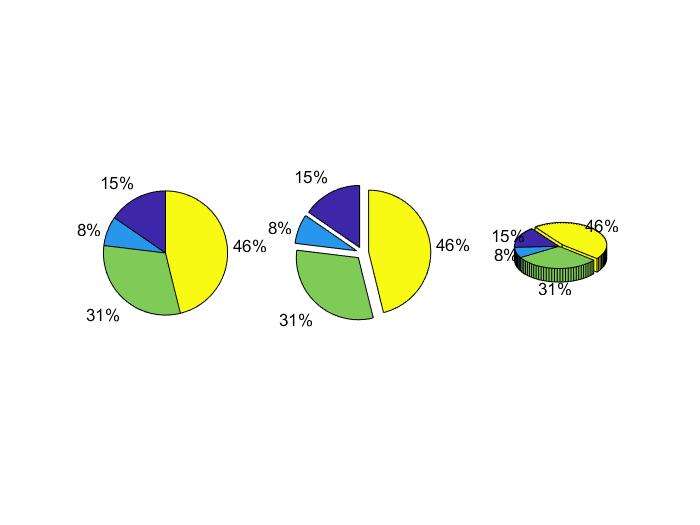
pie charts
修改以下pie()中的方括号的数据可以控制每个部分是否分开
1
2
3
4
5
6clear
a=[10 5 20 30];
subplot(1,3,1); pie(a);
subplot(1,3,2); pie(a,[1,1,1,1]);
subplot(1,3,3); pie3(a,[0,0,0,1]);
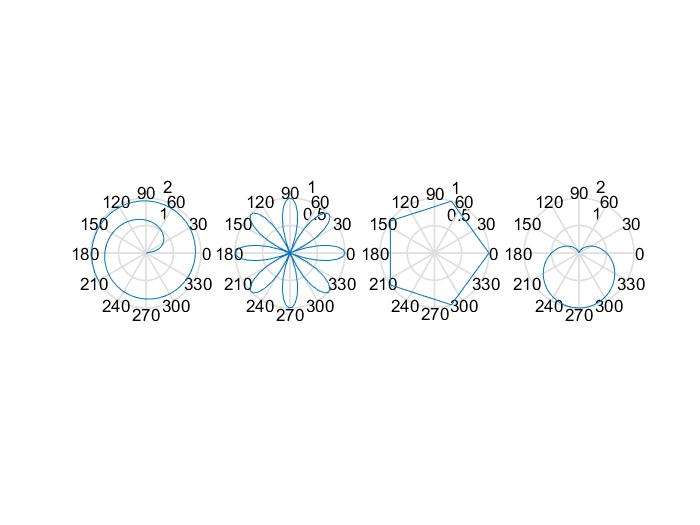
polar char
1 | x=1:100; |
stairs and stem charts
1 | x=linspace(0,4*pi,40); |
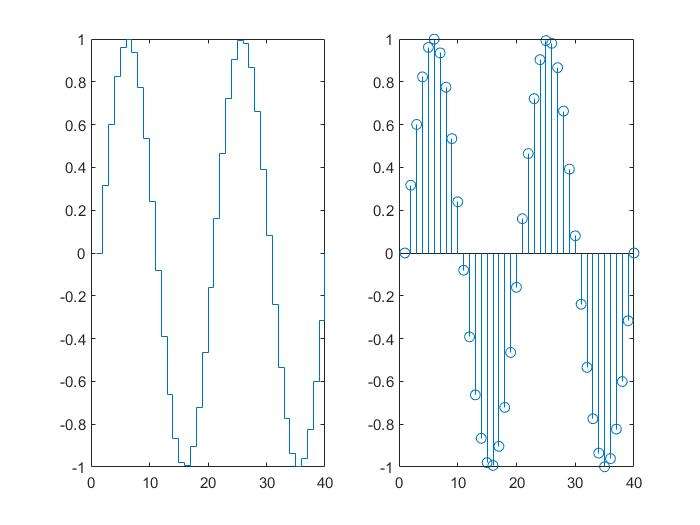
Exerise:
- plot a function:\(f(t)=\sin(\frac{\pi
t^2}{4})\) - add the points sampled at 5 Hz using
stem()
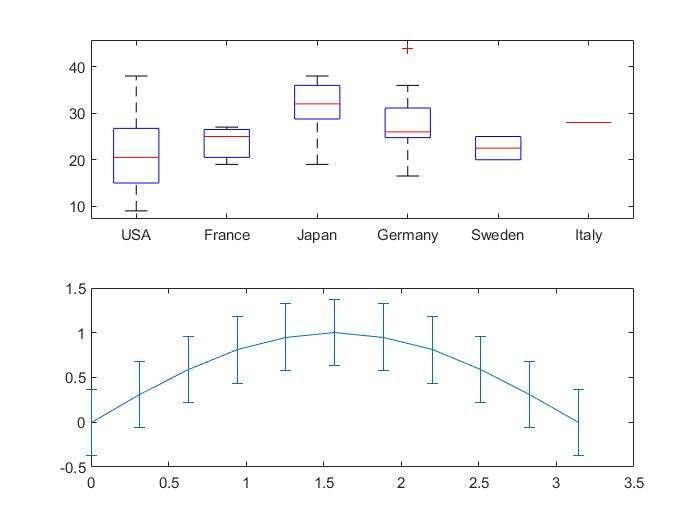
boxplot and error bar
常用于统计应用中
1
2
3
4
5
6
7
8load carsmall
subplot(2,1,1);
boxplot(MPG,Origin);
subplot(2,1,2);
x=0:pi/10:pi;y=sin(x);
e=std(y)*ones(size(x));
errorbar(x,y,e);
stop sign
fil()
将坐标拆成8个等分,绘制八边形。fill的原理是旋转绘制。
1 | t=(1:2:15)'*pi/8;x=sin(t);y=cos(t); |

color space
- [R G B]三色红绿蓝来调制颜色
- 0 is minimun
- 1 is maximum
- 8-bit equivalence
1 | clear; |
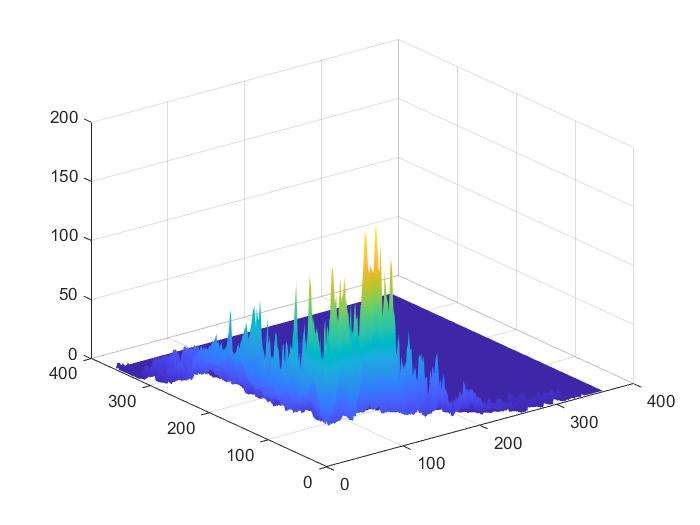
visualizing data as an
image:imagesc()
- display values of matrix as an "image"
1 | [x,y]=meshgrid(-3:2:3,-3:.2:3); |
 - color bar and scheme
colorbar |
colormap(cool) |
colormap(hot) |
colormap(gray) |
|---|---|---|---|
| 加入色条 | 冷色map | 暖色map | 灰色map |
- build-in colormaps
- use built-in color maps
colormap([name]) - a color map is a matrix of 256 times 3
a=colormap(prism) - use a customized color map
a=ones(256,3; colormap(a);
- use built-in color maps
3D plots
| Function | Description |
|---|---|
plot3 |
3-D line plot |
surf |
3-D shaded surface plot |
surfc |
contour(轮廓) plot under a 3-D shaded surface plot |
surface |
create surface object |
meshc |
plot a contour graph under mesh graph |
contour |
contour plot of matrix |
contourf |
filled 2-D contour plot |
2D vs 3D 2D的图像也可以显示在3D上面。
plot3()
1
2
3
4
5
6
7
8
9
10
11
12
13
14
15
16
17
18%%
x=0:0.1:3*pi;z1=sin(x);z2=sin(2*x);z3=sin(3*x);
y1=zeros(size(x));y3=ones(size(x));y2=y3./2;
plot3(x,y1,z1,'r',x,y2,z2,'b',x,y3,z3,'g');grid on;
xlabel('x-axis'); ylabel('y-axis');zlabel('z-label');
%%
clear;
t=0:pi/50:10*pi;
plot3(sin(t),cos(t),t);
grid on; axis square;
%%
turns=40*pi;
t=linspace(0,turns,400);
x=cos(t).*(turns-t)./turns;
y=sin(t).*(turns-t)./turns;
z=t./turns;
plot3(x,y,z);grid on;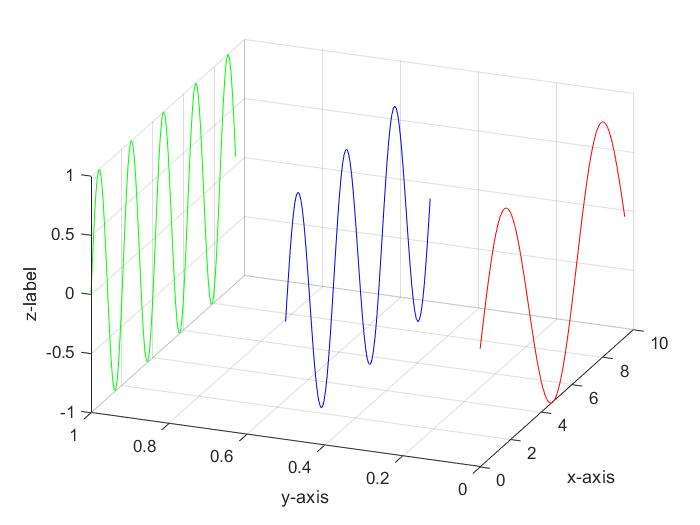
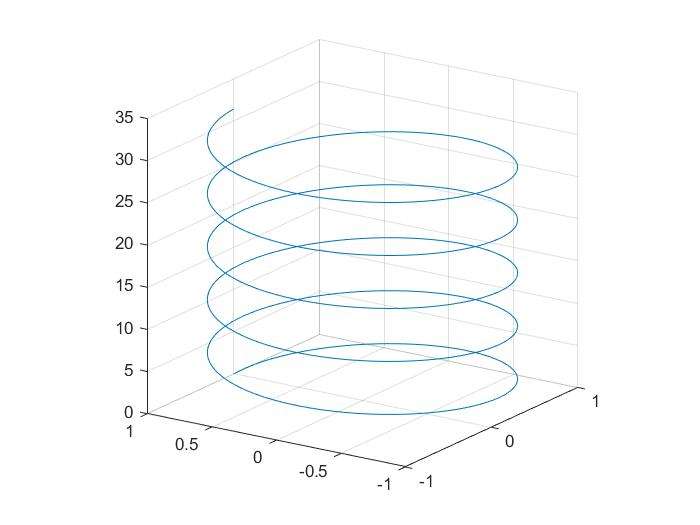
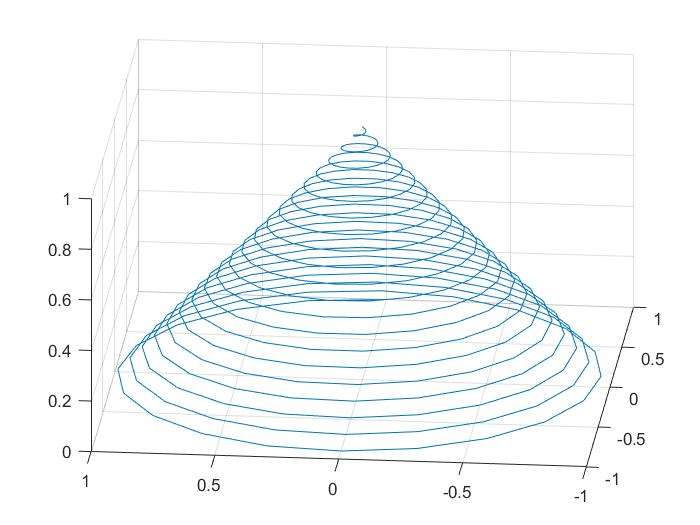 这里是线穿起来的三维图,vector确定点,点连为线
principles of 3D surface plots
- usually for plotting functions:\(z=f(x,y)\)
- need to provide matlab a set of (x,y,z) points
- use
meshgridto create matrices X and Y for a given range
1 | x=-2:1:2; |
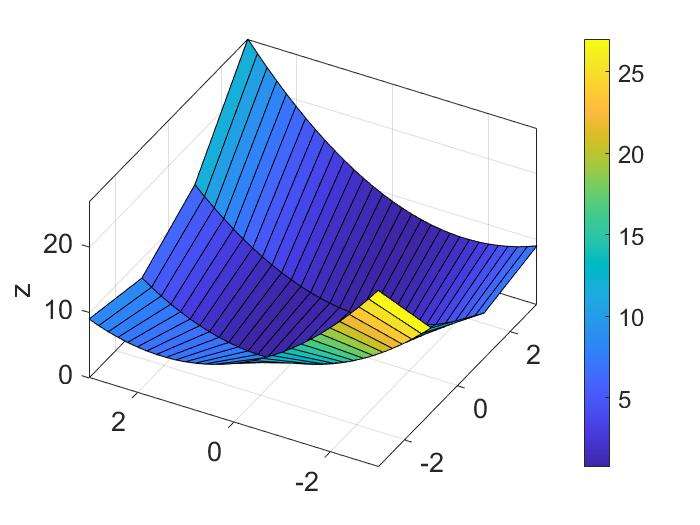
mesh()andsurf()
1
2
3
4
5
6
7x=-3.5:0.2:3.5;
y=-3.5:0.2:3.5;
[X,Y]=meshgrid(x,y);
Z=X.*exp(-X.^2-Y.^2);%向量和矩阵运算最好用点乘
subplot(1,2,1); mesh(X,Y,Z);% axis aquare会更漂亮,效果见下一个例子
subplot(1,2,2); surf(X,Y,Z);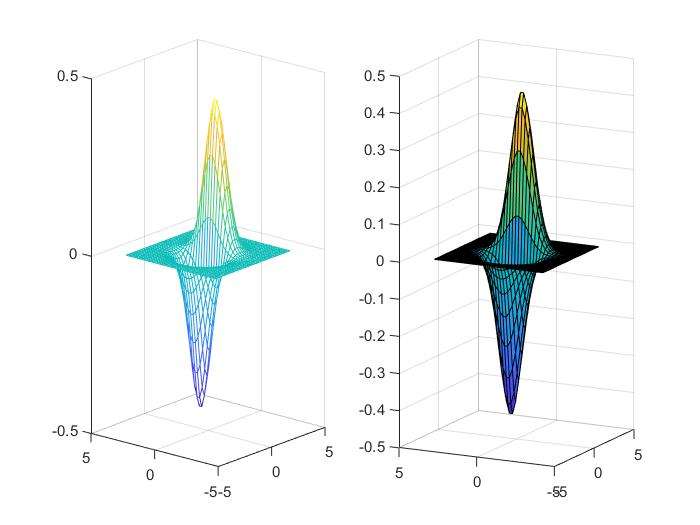
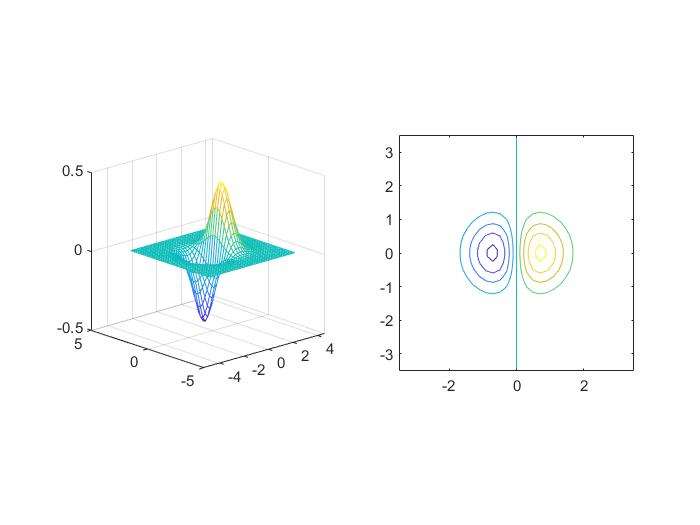
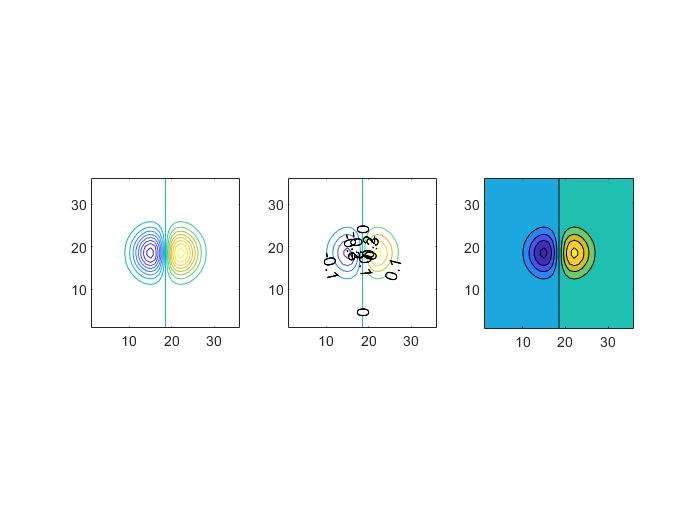
contour()
- projection of equal heights of 3D plot onto a 2D plane
1 | x=-3.5:0.2:3.5; |
1 | x=-3.5:0.2:3.5; |
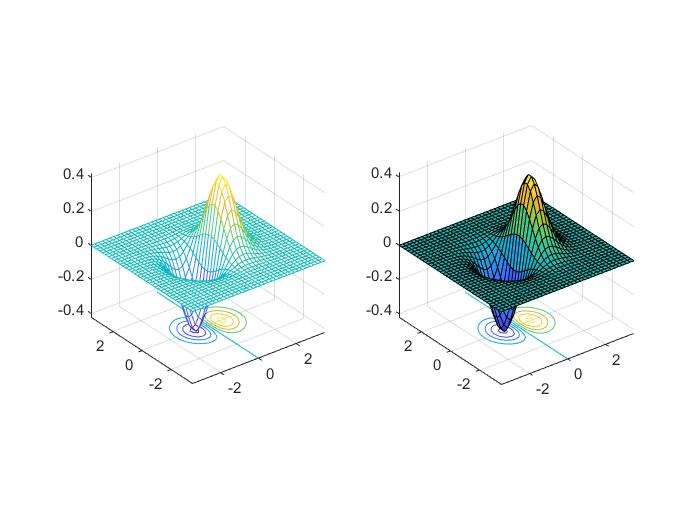
meshc()andsurfc()
- combination of surface/mesh and contours
1 | x=-3.5:0.2:3.5; |
view angle:view()
- vary the view angle view(-45,20)
1 | sphere(50); |
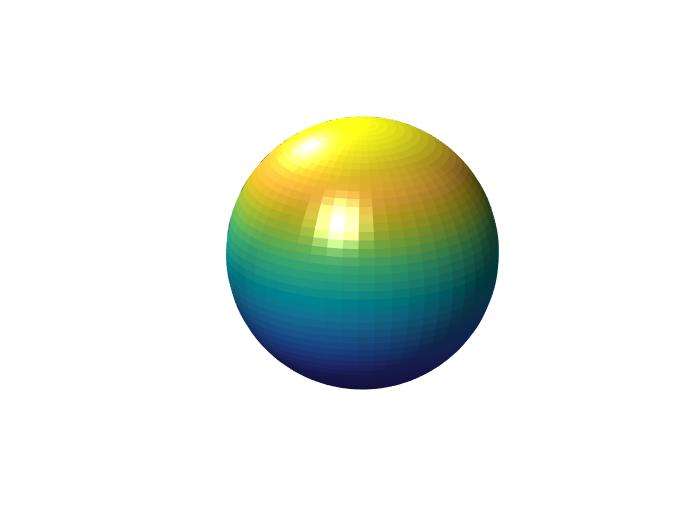
light:light()用于打光
1 | clear; |

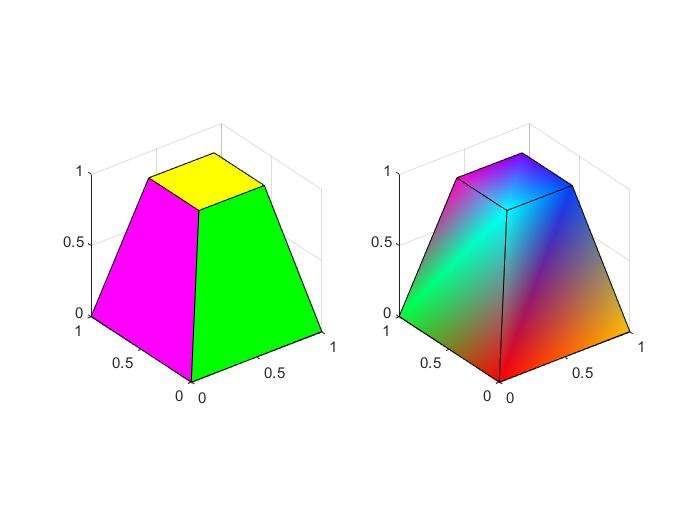
patch()
- a graphical object containing polygons
1 | v=[0 0 0;1 0 0;1 1 0;0 1 0;0.25 0.25 1;... |
professional
1 | clear; |